Dashboard
Overview
The Dashboard is your real-time operations center. It gives you an at-a-glance view of the health and activity of your data platform without needing to navigate into individual sections. The Dashboard is made up of three widgets. You can drag and reorder these widgets by grabbing the handle icon on any widget and moving it to your preferred position. Your layout is saved automatically.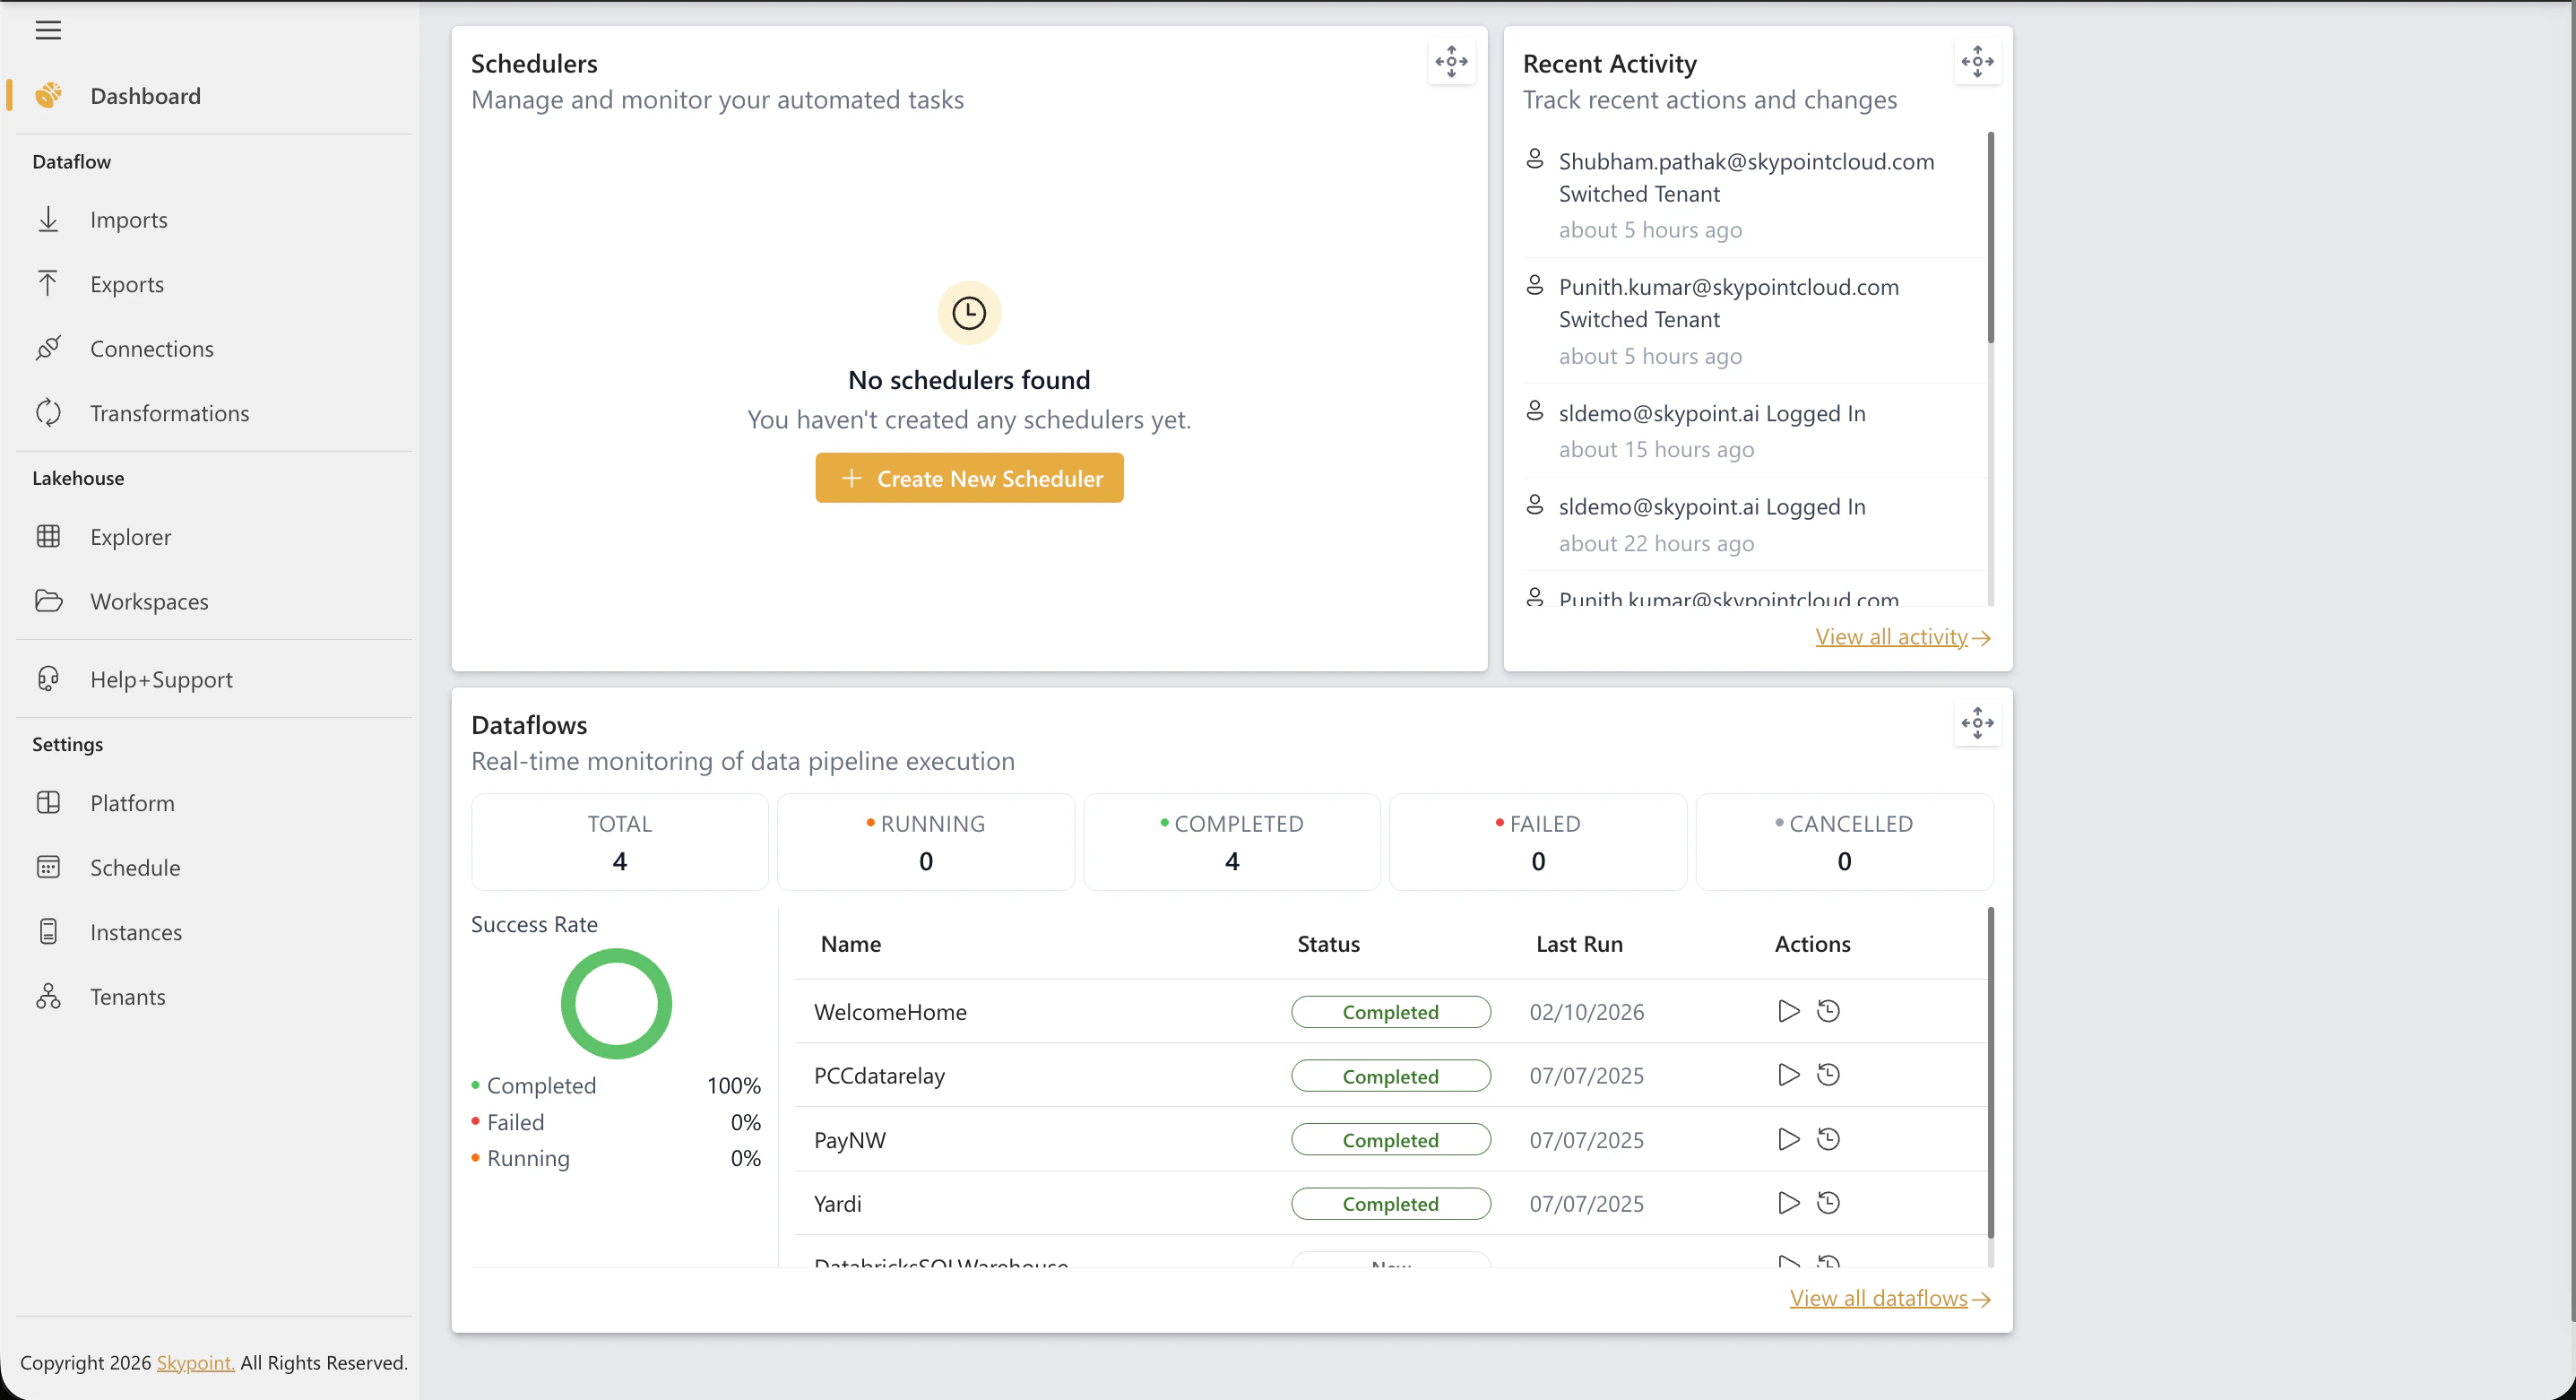
Prerequisite
Log in to skyData using your credentials. If you need help and support, click the Need help? button in the bottom right corner of the page. For more information regarding raising a new ticket, refer to the Help+Support section.Dataflows Widget
This widget shows the current state of all your data import pipelines.- A donut chart displays the percentage breakdown of your dataflows by status: Completed, Running, Failed, and Cancelled
- Below the chart, a table lists your most recent dataflows with their current status and last run date
- Quick action buttons let you Run, Cancel, or View History for any dataflow without leaving the Dashboard
- If you have no dataflows yet, a Create Dataflow button is shown to help you get started
- A View all dataflows link takes you to the full Imports management page
Schedulers Widget
This widget shows the status of your automated pipeline schedules.- Summary counts display the total number of schedules broken down by Active, Running, and Failed
- A list of your most recently updated schedules is shown below
- Quick action buttons let you play (trigger a manual run), stop, or edit each schedule directly from the Dashboard
- A Create Schedule option is available if you have no schedules yet
- A View all schedulers link takes you to the full Schedule management page
Recent Activity Widget
This widget provides a chronological feed of everything that has happened across your platform.- Activities include dataflow runs, connector updates, audience changes, configuration edits, and user actions
- Each entry shows the type of activity, a description, and a relative timestamp (e.g., “2 hours ago”)
- Color-coded icons help you quickly categorize the activity type at a glance