> ## Documentation Index
> Fetch the complete documentation index at: https://docs.skypoint.ai/llms.txt
> Use this file to discover all available pages before exploring further.
#
# Connecting to Campaign Monitor
## Overview
Campaign Monitor is a leading email marketing platform that helps businesses to design and send personalized email messages. You can amplify your business growth with all the resources to manage new subscriptions, send email newsletters and generate reports.
You can use skyData's built-in connector for importing data from Campaign Monitor. skyData collects, analyzes, and provides a solution to transform data into meaningful information for generating valuable insights.
## Prerequisite
You will need the following details to configure and import data with [Campaign monitor](https://www.campaignmonitor.com/api/getting-started/):
* Client ID
* API Key.
## Import data using Campaign Monitor connector
Follow the below steps to create a new dataflow for the Campaign Monitor import connector:
1. Go to **Dataflow > Imports**.
2. Click **New dataflow**.
The **Set dataflow name** page appears.
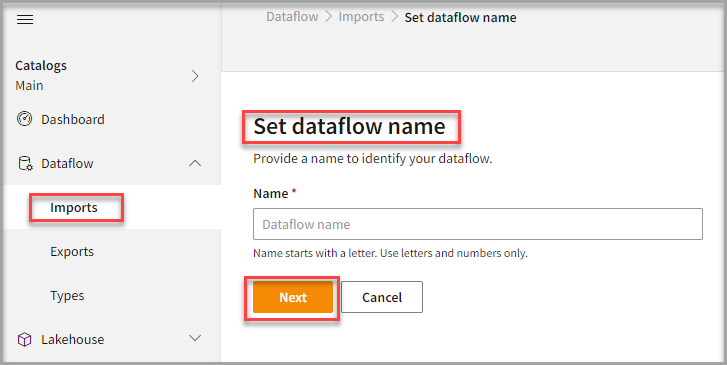 3. In the **Set dataflow name** page, enter dataflow name in the **Name** text area.
4. Click **Next**.
The **Choose connector** page appears.
3. In the **Set dataflow name** page, enter dataflow name in the **Name** text area.
4. Click **Next**.
The **Choose connector** page appears.
 ## To add Campaign Monitor connector
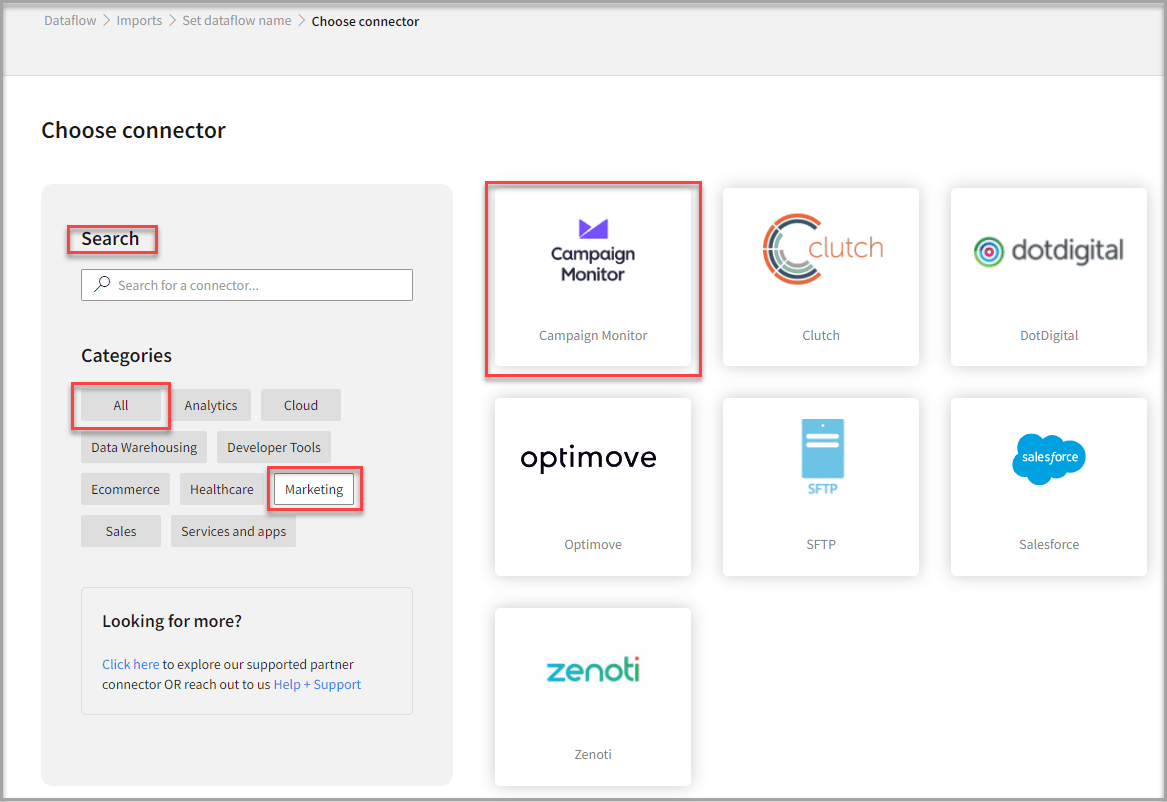
1. In the **Choose connector** page, select **Campaign Monitor** connector.
You can also use the Search feature to find the connector. Additionally, the Campaign Monitor connector is located under the Marketing category.
## To add Campaign Monitor connector
1. In the **Choose connector** page, select **Campaign Monitor** connector.
You can also use the Search feature to find the connector. Additionally, the Campaign Monitor connector is located under the Marketing category.
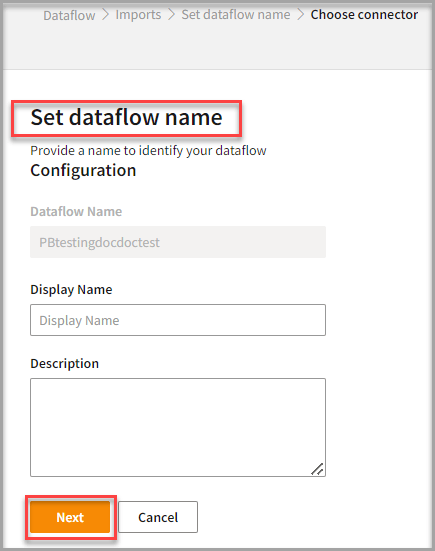 2. Enter **Display Name** for your dataflow in the text area.
3. Enter **Description** for your dataflow in the text area.
4. Click **Next**.
The **Connect to Campaign Monitor** page appears.
2. Enter **Display Name** for your dataflow in the text area.
3. Enter **Description** for your dataflow in the text area.
4. Click **Next**.
The **Connect to Campaign Monitor** page appears.
 ## To configure Campaign Monitor
Follow the below steps to configure the connection to Campaign Monitor:
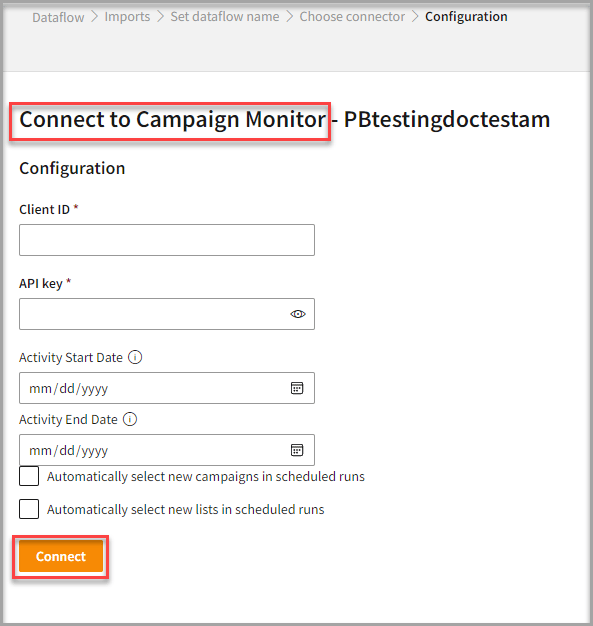
1. Enter your credentials such as **Client ID** and **API Key** to configure with the Boulevard connector.
2. Select **Activity Start Date** to set a start date range to import activities since the beginning.
3. Select **Activity End Date** to set an end date range to import activities till today.
4. Click **Connect**.
The **Table Details** columns appear.
## To configure Campaign Monitor
Follow the below steps to configure the connection to Campaign Monitor:
1. Enter your credentials such as **Client ID** and **API Key** to configure with the Boulevard connector.
2. Select **Activity Start Date** to set a start date range to import activities since the beginning.
3. Select **Activity End Date** to set an end date range to import activities till today.
4. Click **Connect**.
The **Table Details** columns appear.
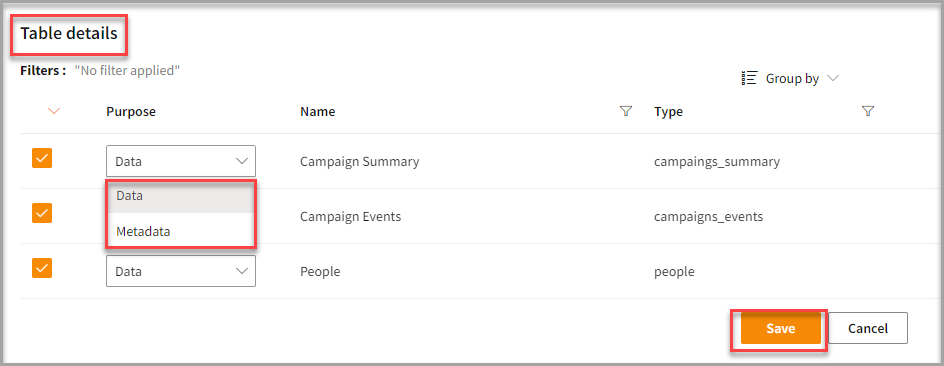 5. Enter the **Table Details** to process the data.
| Item | Description |
| :------- | :------------------------------------------------------------ |
| Purpose | Option to assign a purpose (Data or Metadata) for each table. |
| Data | Loads customer data. |
| Metadata | Loads Metadata. |
| Name | Name of the imported tables. |
| Type | Type of table where the details have been stored. |
6. Click **Save**.
## Run, edit, and delete the imported data
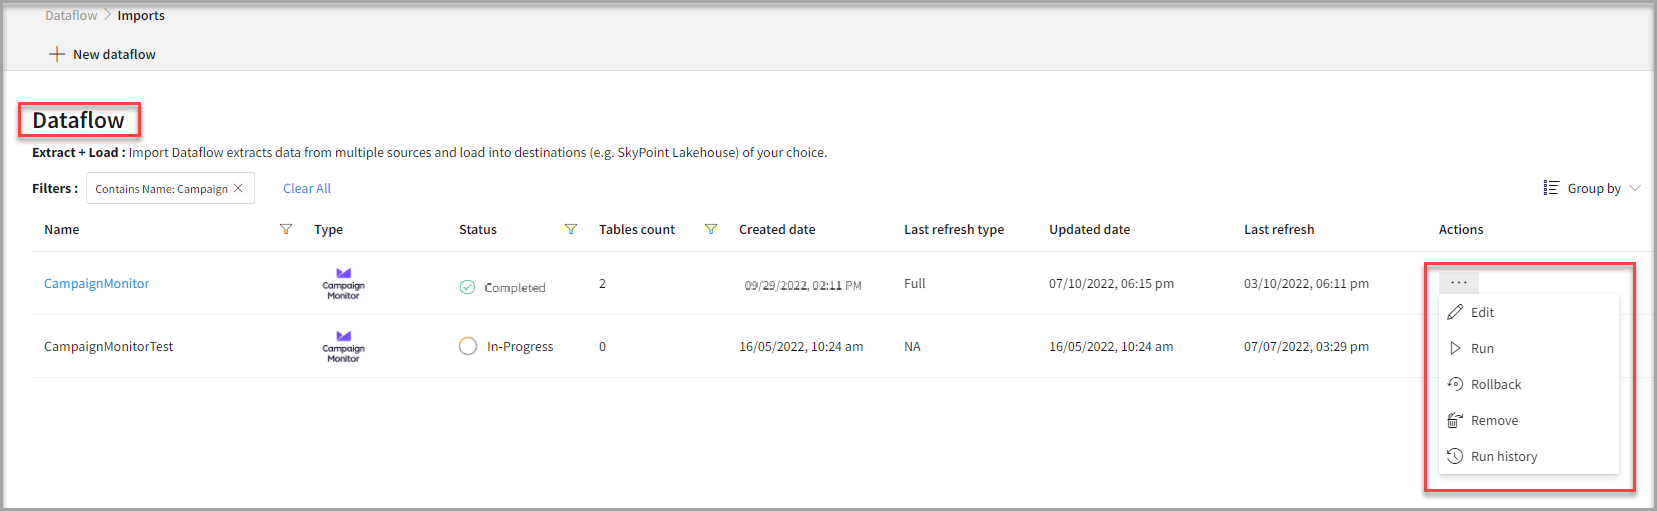
Once you save the connector, the Campaign Monitor connector gets displayed in the list of tables created in the Dataflow page.
5. Enter the **Table Details** to process the data.
| Item | Description |
| :------- | :------------------------------------------------------------ |
| Purpose | Option to assign a purpose (Data or Metadata) for each table. |
| Data | Loads customer data. |
| Metadata | Loads Metadata. |
| Name | Name of the imported tables. |
| Type | Type of table where the details have been stored. |
6. Click **Save**.
## Run, edit, and delete the imported data
Once you save the connector, the Campaign Monitor connector gets displayed in the list of tables created in the Dataflow page.
 | Item | Description |
| :---------------- | :-------------------------------------------------------------------------------------------------------------- |
| Name | Displays the name of the imported Dataflow. |
| Type | Displays connector type symbol. |
| Status | Indicates whether the data is imported successfully. |
| Tables Count | Displays the number of tables. |
| Created Date | Displays date of creation. |
| Last refresh type | Displays the refresh value. You can see whether the value is ‘Full or Incremental’ after the last data refresh. |
| Updated Date | Displays last modified date. |
| Last Refresh | Displays the latest refresh date, which updates each time you refresh the data. |
| Group by | Option to view the items in a specific Group (For example, name, type, status). |
* Select the horizontal ellipsis in the Actions column and do the following:
| If you want to | Then |
| :----------------------------------- | :------------------------------------------------------------------------------------------------- |
| Modify the Dataflow | Select **Edit** and modify the Dataflow. Click **Save** to apply your changes. |
| Execute the Dataflow | Select **Run**. |
| Bring the data to its previous state | Select **Rollback**. |
| Delete the Dataflow | Select **Remove** and then click the **Delete** button. All tables in the data source get deleted. |
| See the run history of the Dataflow | Select **Run** history. |
## Next step
After completing the data import, start the [Master Data Management (MDM) - Stitch](stitch.md) process to develop a unified view of your customers.
| Item | Description |
| :---------------- | :-------------------------------------------------------------------------------------------------------------- |
| Name | Displays the name of the imported Dataflow. |
| Type | Displays connector type symbol. |
| Status | Indicates whether the data is imported successfully. |
| Tables Count | Displays the number of tables. |
| Created Date | Displays date of creation. |
| Last refresh type | Displays the refresh value. You can see whether the value is ‘Full or Incremental’ after the last data refresh. |
| Updated Date | Displays last modified date. |
| Last Refresh | Displays the latest refresh date, which updates each time you refresh the data. |
| Group by | Option to view the items in a specific Group (For example, name, type, status). |
* Select the horizontal ellipsis in the Actions column and do the following:
| If you want to | Then |
| :----------------------------------- | :------------------------------------------------------------------------------------------------- |
| Modify the Dataflow | Select **Edit** and modify the Dataflow. Click **Save** to apply your changes. |
| Execute the Dataflow | Select **Run**. |
| Bring the data to its previous state | Select **Rollback**. |
| Delete the Dataflow | Select **Remove** and then click the **Delete** button. All tables in the data source get deleted. |
| See the run history of the Dataflow | Select **Run** history. |
## Next step
After completing the data import, start the [Master Data Management (MDM) - Stitch](stitch.md) process to develop a unified view of your customers.